From Goals To Action (Part 1 of 4): The KPI Tree
How to apply KPI trees to pin down outcomes that move the needle
Organizations spend a significant amount of time defining ambitious strategies and breaking them down into more manageable time-bound goals. Each goal and its measurable results is a means to explicitly communicate strategic direction throughout the organization and allow teams to align their efforts. Because of the high-level and often trailing nature of strategic business results, the path to concrete and effective action is often everything else but straightforward.
In this short series of articles, we’ll discuss concrete methods that allow you to systematically deconstruct strategic challenges, plot a path from your circle of concern to your circle of control, and identify impactful actions. First in line: the Key Performance Indicator (KPI) Tree.
💡 You’ll learn
how a KPI tree serves as a tool to break down overarching goals into specific, manageable metrics.
how to construct a KPI tree from your goal metrics to gain a more nuanced understanding of what drives them.
how these leading indicators show you the levers to impact your business results.
how business results are dependent on system actor behaviors.
how all the above can guide you in taking effective action towards achieving your business goals.
It’s Tuesday morning. A product team of a mobile banking app comes together in a meeting. The Product Manager had scheduled the session the day before right after her biweekly meeting with the CPO and the other PMs. The company’s management is alarmed because user numbers have been stagnating over the last three months. The board has voiced its worries about potentially missing the agreed growth goals.
As our product team’s last initiative had just come to a close, the CPO tasked the PM with the high-priority goal to get user growth back up to 15% month over month. After the Product Manager has shared the new goal with the team, people start to bounce some ideas around on how to tackle this challenge. But quickly they realize that they’ll need a more structured approach to bridge the gap between their circle of concern and their circle of control and determine the most meaningful course of action.
Meet The KPI Tree
A KPI tree, a specialized form of a Logic Tree (also known as an Issue Tree), is a tool that breaks down overarching goals into specific, manageable metrics. This tool visually represents, in a tree-like structure, the actual and hypothesized relationships between metrics that directly or indirectly contribute to the measurements of a business goal.
A goal typically outlines a desired change, such as an absolute or relative increase or decrease, in one or more critical business metrics. In our example, this change is the increase of the monthly user growth rate to 15%. While the change signifies the intended result, the underlying metric (monthly user growth rate) directly indicates progress, a so-called Key Performance Indicator (KPI), toward achieving the business goal.
By building KPI trees from these indicators, we can gain a more nuanced understanding of the challenge. This is achieved by breaking down the high-level KPIs into more specific and less complex metrics. Due to their influence on the KPIs, these lower-level metrics act as leading indicators. Their progression will provide an indication of the future development of our KPIs.
The KPI Tree In Action
But let’s see how our product team uses a KPI tree to approach their challenge. As the user retention rate is their direct measure of progress, it represents the root of their KPI tree will be growing from.
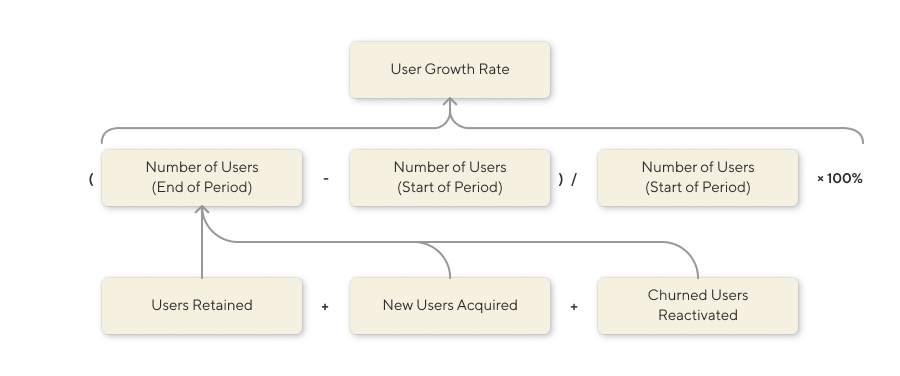
Next, they brainstorm and try to logically derive the direct contributors to this goal, the metrics that pay into user growth. As business result metrics usually are high-level composite ones, the team starts with breaking user growth down into the sub-metrics it is calculated from, according to the formula:
The user growth rate has only one driver: The growth rate increases with the increase in the number of users at the end of the period. But what drives the change in the number of users over time? After a short discussion, the team determines that the number of users is ultimately the sum of the users retained, new users acquired, and churned users reactivated.
Following the math behind your KPIs like this is most often the simplest way to get you started. So, the team draws the base of their KPI tree to a whiteboard like this:
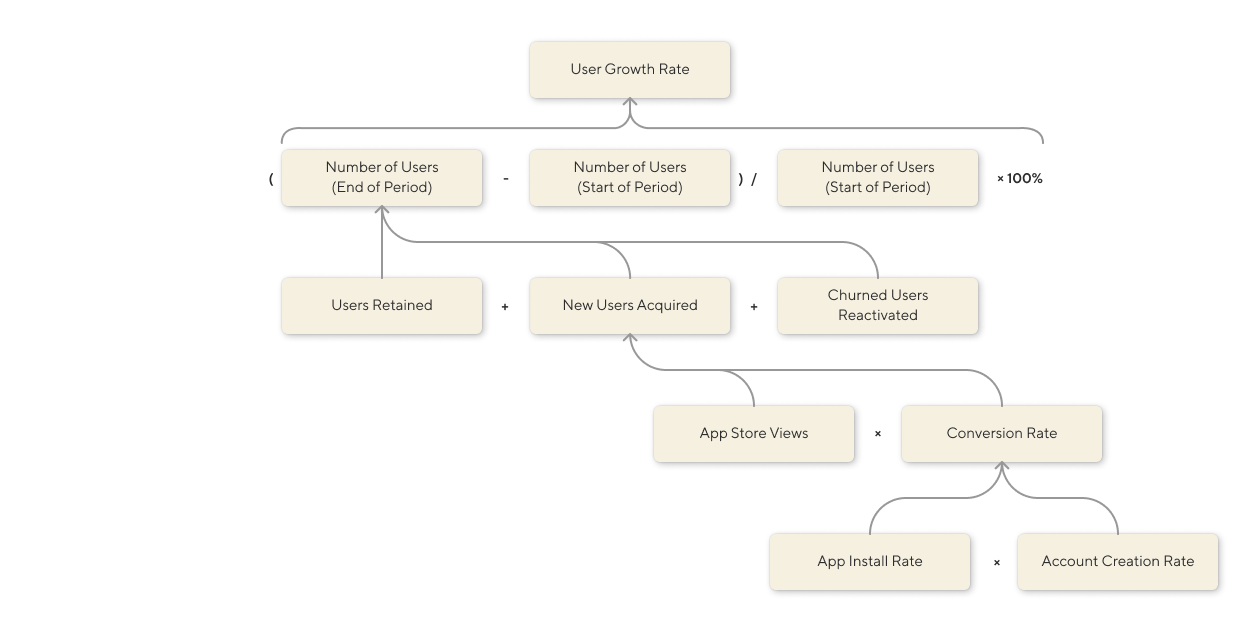
In this very first step, the team already identified three high-level areas of leverage to influence the user growth rate. But the team decides to dig deeper into the areas of user retention and acquisition. They further break down the latter with ease as the drivers are pretty straightforward: New users result from the number of people who find the product in the app store multiplied by the conversion rate. To increase the detail even more, the team breaks down the conversion rate into the app install rate and the account creation rate.
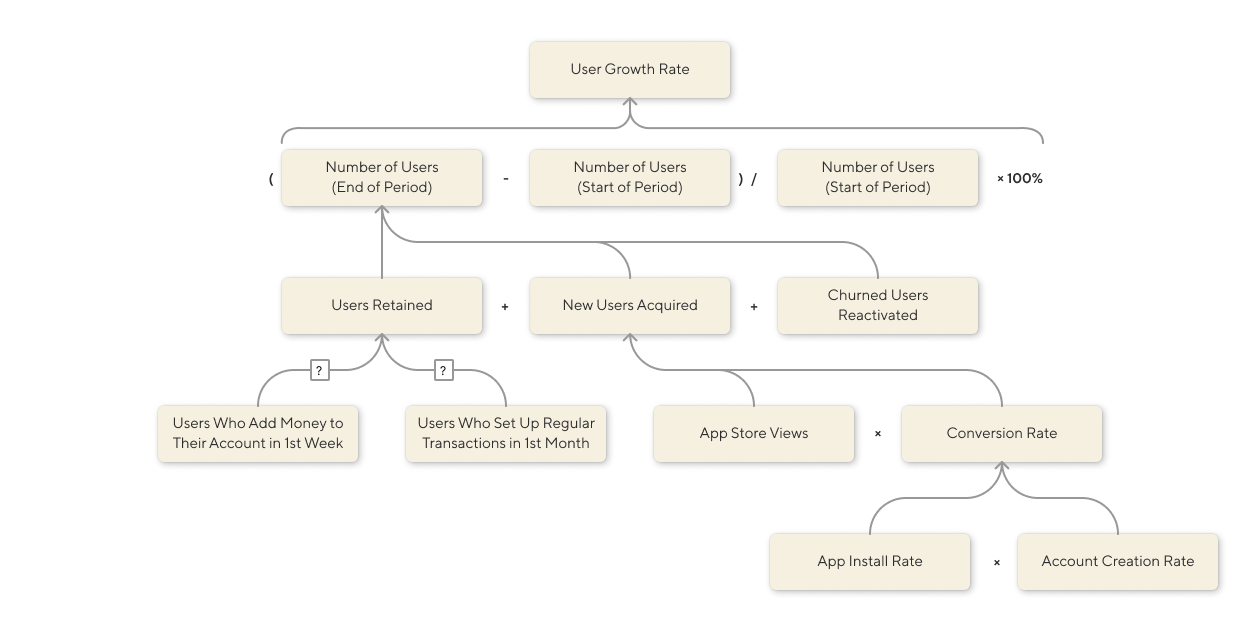
Then they move their focus to the number of retained users. Things get a bit messier here as the causes of users staying or leaving are manifold. Where math and logic don’t do the job, observation and the search for correlations can be a great starting point. The team decides to dig into the product analytics looking for new users’ behaviors that could somewhat reliably indicate a 3+ months retention after the users have opened an account.
They learn that 40%+ of people who add an amount of 100€+ to their account within the first week are still using the product after 3 months. Of the users who show regular receipts like salaries from the first month on, the retention rate within the first 3 months is even close to an impressive 75%. Assuming that increasing the number of people that deposit cash in their account or set up a regular transaction will improve overall retention, the team adds those drivers to their KPI tree. To reflect that this, as an observed correlation, is rather a theory, for now, they mark the relation with question marks.
After talking through the KPI tree again, our product team looks satisfied and confident that the level of detail will serve them well as a basis for their next steps. But what did they achieve? They:
broke a high-level lagging abstract result metric down into more concrete and actionable leading indicators that drive the business result,
created a map that, in combination with the data for each of those leading indicators, allows them to identify the most relevant bottlenecks that impact the relevant business results,
established, in a collaborative process, a shared understanding of how their business results come to be based on logic and data,
and manifested that understanding in an easy-to-comprehend artifact that will help facilitate further conversations in and beyond the team.
Conclusion
Given the above, three main points from my previous article are worth recapitulating here. First:
💡 All business results are ultimately driven by human behaviors.
As our team broke down the user growth rate, we ended up with leading indicators that describe observable behaviors of system actors who, in our case, are the users of our imaginary mobile banking app. Whether it is viewing the App Store page, installing the app, or adding money to their account, it all describes actions humans take that, directly or indirectly, feed into business results like growth or revenue. Consequently, to impact those business results (i.e. increase the growth rate by 15%), we need to focus on human behavior because:
💡 You can’t change business results but the behaviors that drive them.
Applying the KPI tree, we identified those behaviors that provide us with the levers to achieve our business goals. While we cannot change the growth rate directly, we can influence how people behave in decisive moments for the evolution of our high-level business metric. This is precisely what our product team will be focussing on. The changes in user behavior, or what we call outcomes, become their direct measure of success:
💡 Outcomes are the measurable changes in system actor behaviors in a given system context.
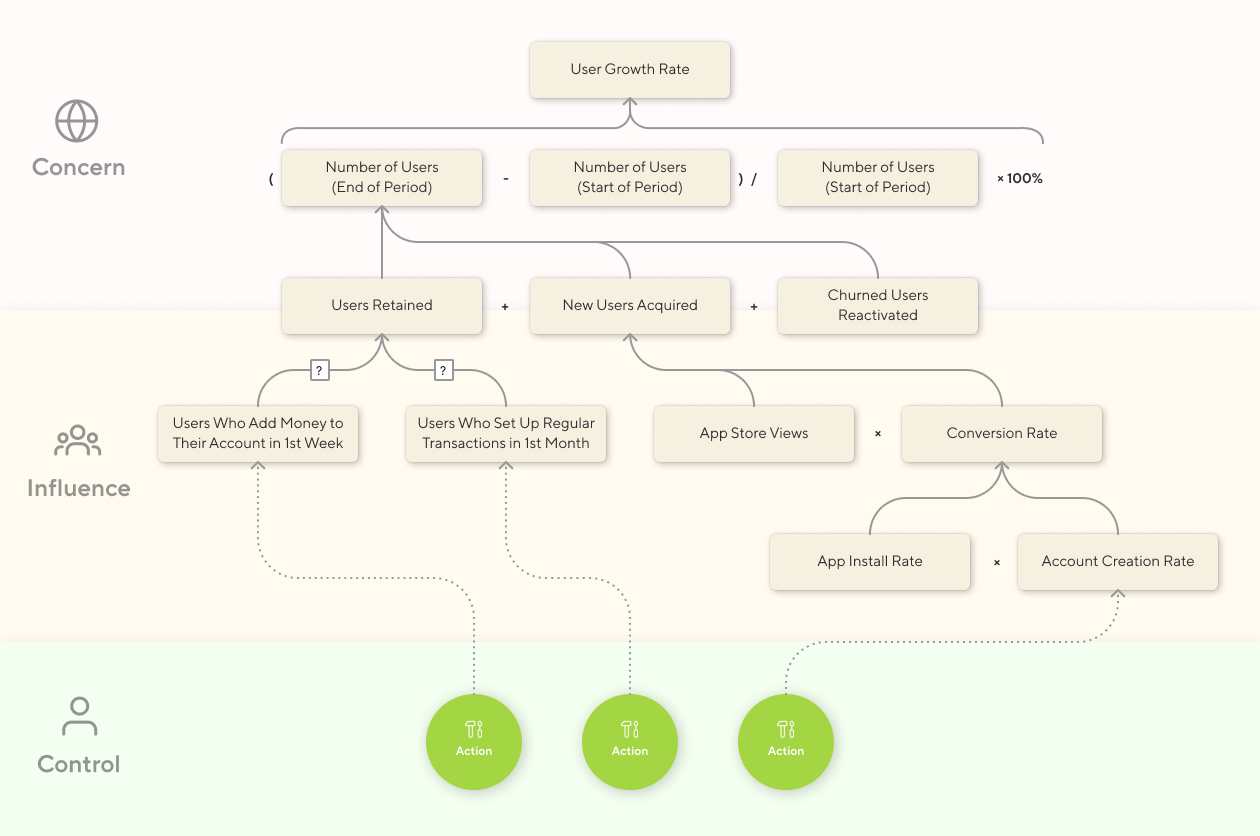
The depth and shape of your KPI trees will vary depending on your goals and metrics. But the most important and valuable aspect of utilizing this tool is that it allows you to pull your challenge out of your nebulous circle of concern and further and further down into your circle of influence by breaking it down into system actor behaviors that you can influence through what you can directly do or build. This helps you ensure a reliable connection of your actions to the business results you seek to impact. And as you derive your actions directly from leading indicators, you already have the relevant measures to evaluate your progress and effectiveness.
A Look Ahead
The KPI tree is a structured and repeatable way to navigate the often daunting gap between your goals and meaningful action. In the next article, we'll be diving into another powerful tool called “Impact Mapping”. It will provide you with another structured method for identifying meaningful opportunities for impacting business results through changing system actor behavior and plotting promising paths from complex challenges down into our circles of influence and control.


